| View previous topic :: View next topic |
| Author |
Message |
pilight

Joined: 23 Sep 2004
Posts: 67052
Location: Where the action is
Back to top |
 Posted: 09/15/11 12:45 pm ::: Posted: 09/15/11 12:45 pm ::: |
Reply  |
|
The league set a new record high for weighted average age. The mean age is the third highest ever. The percentage of players under 30 is the second lowest since the 2000 expansion.
These are not good trends, and they're directly attributable to the 11 person roster.
| Code: |
Year mean age median age weighted average % under 30
1997 26.51 25.5 27.22 74.2
1998 26.31 26 26.91 75.6
1999 26.64 25 27.29 75.3
2000 26.07 25 26.51 81.4
2001 26.09 25 26.77 80.2
2002 26.22 25 26.74 78.9
2003 26.68 26 27.21 79.1
2004 26.13 25 26.75 81.7
2005 26.10 25 26.99 80.3
2006 25.98 25 26.51 79.7
2007 26.15 25 26.68 79.7
2008 26.08 25 26.85 81.3
2009 26.49 26 27.07 78.0
2010 26.50 26 27.32 80.6
2011 26.63 26 27.34 78.9 |
_________________
I'm a lonely frog
I ain't got a home
|
|
pilight
Joined: 23 Sep 2004
Posts: 67052
Location: Where the action is
Back to top |
| Posted: 10/08/11 10:22 am ::: |
Reply |
|
| GlennMacGrady wrote: |
| What would we expect to see if we correlated age with a performance stat such as scoring or rebounding -- a slope, a bell curve, ??? |
I did All WNBA teams...
| Code: |
year avg 30+ under 25
1997 28.2 4 5
1998 29.5 6 1
1999 27.3 2 4
2000 28.2 3 1
2001 27.6 3 1
2002 26.8 2 3
2003 25.1 2 7
2004 26.4 2 4
2005 28.5 4 3
2006 27.7 3 3
2007 26.7 2 2
2008 27.6 2 2
2009 28.6 3 1
2010 26.5 2 4
2011 27.5 3 2 |
Other than a couple of outliers, the average has remained very consistent between 26 and 28
_________________
I'm a lonely frog
I ain't got a home
|
|
pilight
Joined: 23 Sep 2004
Posts: 67052
Location: Where the action is
Back to top |
| Posted: 10/24/11 6:40 pm ::: |
Reply |
|
Decided to run the averages for championship teams. Since the end of the Comets dynasty, only a couple of outliers have been more than a year off the league average...
| Code: |
Season weighted average weighted champ diff
1997 27.22 29.17 +1.95
1998 26.91 29.14 +2.23
1999 27.29 29.68 +2.39
2000 26.51 29.58 +3.07
2001 26.77 26.14 -0.63
2002 26.74 26.93 +0.19
2003 27.21 24.17 -3.04
2004 26.75 26.82 +0.07
2005 26.99 26.40 -0.59
2006 26.51 26.73 +0.22
2007 26.68 26.59 -0.09
2008 26.85 28.01 +1.16
2009 27.07 26.55 -0.52
2010 27.32 27.75 +0.43
2011 27.34 27.73 +0.39 |
_________________
I'm a lonely frog
I ain't got a home
|
|
ClayK
Joined: 11 Oct 2005
Posts: 11187
Back to top |
| Posted: 10/24/11 7:00 pm ::: |
Reply |
|
Since the demise of the veteran Comets, all of the numbers validate Bill James' huge study of baseball players: The athletic prime year is age 27 (though obviously there are exceptions).
In fact, in baseball circles, great performances can be, and are, somewhat dismissed as "age 27 seasons."
_________________
Oṃ Tāre Tuttāre Ture Svāhā
|
|
pilight
Joined: 23 Sep 2004
Posts: 67052
Location: Where the action is
Back to top |
| Posted: 10/24/11 7:32 pm ::: |
Reply |
|
| ClayK wrote: |
Since the demise of the veteran Comets, all of the numbers validate Bill James' huge study of baseball players: The athletic prime year is age 27 (though obviously there are exceptions).
In fact, in baseball circles, great performances can be, and are, somewhat dismissed as "age 27 seasons." |
It doesn't look good for the Lynx repeat chances, as they have their age heavily concentrated in their starters. McWilliams is 40, of course. Whalen and Brunson will be 30 next season. Augustus is 27 now.
_________________
I'm a lonely frog
I ain't got a home
|
|
Howee

Joined: 27 Nov 2009
Posts: 15754
Location: OREGON (in my heart)
Back to top |
| Posted: 10/24/11 9:30 pm ::: |
Reply |
|
| Pilight, why is the 2010 season considered "incomplete"?? I'm surprised you don't have 2011 up there! LOL!
_________________
Oregon: Go Ducks!
"Inévitablement, les canards voleront"
|
|
pilight
Joined: 23 Sep 2004
Posts: 67052
Location: Where the action is
Back to top |
| Posted: 10/24/11 10:04 pm ::: |
Reply |
|
| Howee wrote: |
| Pilight, why is the 2010 season considered "incomplete"?? I'm surprised you don't have 2011 up there! LOL! |
b/c that post happened in July of 2010. Look further down the thread for more recent data.
_________________
I'm a lonely frog
I ain't got a home
|
|
FS02
Joined: 19 Jul 2006
Posts: 9699
Location: Husky (west coast) Country
Back to top |
| Posted: 10/24/11 11:11 pm ::: |
Reply |
|
| ClayK wrote: |
Since the demise of the veteran Comets, all of the numbers validate Bill James' huge study of baseball players: The athletic prime year is age 27 (though obviously there are exceptions).
In fact, in baseball circles, great performances can be, and are, somewhat dismissed as "age 27 seasons." |
Hmm. Women have a longer life-expectancy than men, so I wonder if the peak age would be a little later for them.
_________________
@dtmears2
|
|
pilight
Joined: 23 Sep 2004
Posts: 67052
Location: Where the action is
Back to top |
| Posted: 10/24/11 11:19 pm ::: |
Reply |
|
| FS02 wrote: |
| ClayK wrote: |
Since the demise of the veteran Comets, all of the numbers validate Bill James' huge study of baseball players: The athletic prime year is age 27 (though obviously there are exceptions).
In fact, in baseball circles, great performances can be, and are, somewhat dismissed as "age 27 seasons." |
Hmm. Women have a longer life-expectancy than men, so I wonder if the peak age would be a little later for them. |
The evidence doesn't support that theory.
_________________
I'm a lonely frog
I ain't got a home
|
|
Howee
Joined: 27 Nov 2009
Posts: 15754
Location: OREGON (in my heart)
Back to top |
|
pilight
Joined: 23 Sep 2004
Posts: 67052
Location: Where the action is
Back to top |
| Posted: 09/25/12 1:44 pm ::: |
Reply |
|
Update for 2012
| Code: |
Year mean age median age weighted average % under 30
1997 26.51 25.5 27.22 74.2
1998 26.31 26 26.91 75.6
1999 26.64 25 27.29 75.3
2000 26.07 25 26.51 81.4
2001 26.09 25 26.77 80.2
2002 26.22 25 26.74 78.9
2003 26.68 26 27.21 79.1
2004 26.13 25 26.75 81.7
2005 26.10 25 26.99 80.3
2006 25.98 25 26.51 79.7
2007 26.15 25 26.68 79.7
2008 26.08 25 26.85 81.3
2009 26.49 26 27.07 78.0
2010 26.50 26 27.32 80.6
2011 26.63 26 27.34 78.9
2012 26.98 26 27.20 72.6 |
The mean age is the highest in league history. The percentage of players who are under 30 is off the scales low. The weighted average dropped a bit thanks to many veteran injuries and the tankeriffic Merc.
_________________
I'm a lonely frog
I ain't got a home
|
|
toad455
Joined: 16 Nov 2005
Posts: 22477
Location: NJ
Back to top |
| Posted: 09/25/12 2:47 pm ::: |
Reply |
|
| The drop off in players under 30 is simply due to the 11 player roster limit. Teams will keep a veteran player(i.e. Ashley Robinson, Nakia Sanford, Erin Thorn) instead of an underdeveloped rookie. Those 12th & 13th spots were usually to develop younger players for coaches that thought there was potential.
_________________
LET'S GO LIBERTY!!!!!!
Twitter: @TBRBWAY
|
|
ClayK
Joined: 11 Oct 2005
Posts: 11187
Back to top |
| Posted: 09/25/12 3:24 pm ::: |
Reply |
|
At the same time, though, note that the average age, and average weighted age, has barely changed at all. More teams and bigger rosters did not result in any sort of youth movement. The best players still play, and they're still around 27.
(The last is just more proof of the theory that athletic ability peaks at age 27 ... there are exceptions, but in baseball, the "age 27 season" is so notable as an outlier and peak performance that it's often discounted by stats-oriented GMs when they sign players to long-term contracts.)
_________________
Oṃ Tāre Tuttāre Ture Svāhā
|
|
pilight
Joined: 23 Sep 2004
Posts: 67052
Location: Where the action is
Back to top |
| Posted: 09/17/13 11:01 am ::: |
Reply |
|
2013 update
| Code: |
Year mean age median age weighted average % under 30
1997 26.51 25.5 27.22 74.2
1998 26.31 26 26.91 75.6
1999 26.64 25 27.29 75.3
2000 26.07 25 26.51 81.4
2001 26.09 25 26.77 80.2
2002 26.22 25 26.74 78.9
2003 26.68 26 27.21 79.1
2004 26.13 25 26.75 81.7
2005 26.10 25 26.99 80.3
2006 25.98 25 26.51 79.7
2007 26.15 25 26.68 79.7
2008 26.08 25 26.85 81.3
2009 26.49 26 27.07 78.0
2010 26.50 26 27.32 80.6
2011 26.63 26 27.34 78.9
2012 26.98 26 27.20 72.6
2013 26.30 26 26.72 75.3
|
Mean age and weighted average age dropped to the lowest of the 11-player roster era. Percentage of players under 30 is still low, but a step up over last season.
_________________
I'm a lonely frog
I ain't got a home
|
|
kool-aide
Joined: 09 Jun 2009
Posts: 1650
Back to top |
|
tfan

Joined: 31 May 2010
Posts: 9711
Back to top |
| Posted: 09/17/13 8:07 pm ::: |
Reply |
|
| How much does the average age of starting-lineups, all-star teams and national teams change from the WNBA average?
|
|
pilight
Joined: 23 Sep 2004
Posts: 67052
Location: Where the action is
Back to top |
| Posted: 09/17/13 8:37 pm ::: |
Reply |
|
| tfan wrote: |
| How much does the average age of starting-lineups, all-star teams and national teams change from the WNBA average? |
Starting lineups can be fluid over the course of a season. You could do it by games started, I suppose, but I'm not sure that would answer the question you're asking.
I haven't done All Star teams or national teams, but I have done All WNBA teams:
| Code: |
year avg 30+ under 25
1997 28.2 4 5
1998 29.5 6 1
1999 27.3 2 4
2000 28.2 3 1
2001 27.6 3 1
2002 26.8 2 3
2003 25.1 2 7
2004 26.4 2 4
2005 28.5 4 3
2006 27.7 3 3
2007 26.7 2 2
2008 27.6 2 2
2009 28.6 3 1
2010 26.5 2 4
2011 27.5 3 2
2012 27.0 2 2 |
_________________
I'm a lonely frog
I ain't got a home
|
|
ClayK
Joined: 11 Oct 2005
Posts: 11187
Back to top |
| Posted: 09/18/13 11:27 am ::: |
Reply |
|
I think the numbers make it pretty clear that age 27 is, as in most sports, peak value for WNBA players -- which should be taken into account in trades and free-agent signings.
Or, to put it another way, expecting players to get better after age 27 is expecting to get really lucky, and expecting players 30 or older to not decline is like spitting into the wind.
_________________
Oṃ Tāre Tuttāre Ture Svāhā
|
|
Howee
Joined: 27 Nov 2009
Posts: 15754
Location: OREGON (in my heart)
Back to top |
|
pilight
Joined: 23 Sep 2004
Posts: 67052
Location: Where the action is
Back to top |
|
Shades
Joined: 10 Jul 2006
Posts: 63872
Back to top |
| Posted: 08/18/14 3:53 pm ::: |
Reply |
|
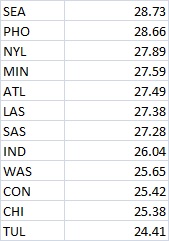
So I was right. TUL is the youngest and not CHI as reported by that one article.
TUL in 2015 should get even younger if they add a 2015 lottery pick and Cambage (who just turned 23) and cut Hodges and Lacy. WNBA record for youth?
Well, maybe Plaisance would get the ax.
_________________
Nnekalonians 1:14 - Thou shalt not accept that which is not earned
|
|
pilight
Joined: 23 Sep 2004
Posts: 67052
Location: Where the action is
Back to top |
| Posted: 09/11/14 3:24 pm ::: |
Reply |
|
Average Age of All WNBA teams
| Code: |
year avg 30+ under 25
1997 28.2 4 5
1998 29.5 6 1
1999 27.3 2 4
2000 28.2 3 1
2001 27.6 3 1
2002 26.8 2 3
2003 25.1 2 7
2004 26.4 2 4
2005 28.5 4 3
2006 27.7 3 3
2007 26.7 2 2
2008 27.6 2 2
2009 28.6 3 1
2010 26.5 2 4
2011 27.5 3 2
2012 27.0 2 2
2013 27.6 3 3
2014 26.6 3 3 |
_________________
I'm a lonely frog
I ain't got a home
|
|
ClayK
Joined: 11 Oct 2005
Posts: 11187
Back to top |
| Posted: 09/12/14 11:31 am ::: |
Reply |
|
| Further proof of the athletic peak at age 27 theory ...
_________________
Oṃ Tāre Tuttāre Ture Svāhā
|
|
ArtBest23
Joined: 02 Jul 2013
Posts: 14550
Back to top |
| Posted: 09/12/14 11:49 am ::: |
Reply |
|
| pilight wrote: |
The mean age is the highest in league history. The percentage of players who are under 30 is off the scales low. The weighted average dropped a bit thanks to many veteran injuries and the tankeriffic Merc. |
It's interesting if you consider this together with the analyses in the two articles in the thread Boston Globe: WNBA Still Looking for an Identity.
If those writers are correct, the focus on 10 year vets reflected in these statistics is not helping the league prosper.
|
|
Happycappie25
Joined: 07 Feb 2006
Posts: 4174
Location: QUEENS!!!!
Back to top |
|
|
|